
Portfolio intelligence

One investment dashboard for your whole portfolio

Track holdings, performance, trades, dividends, broker connections, and market updates in one investment dashboard built for long-term portfolio decisions.

Navero performance dashboard

Portfolio overview

See your whole portfolio

See accounts, holdings, allocation, performance, income, and upcoming portfolio events in one clean view without jumping between broker apps or rebuilding spreadsheets.

  • Track total portfolio value across every account
  • See realized and unrealized gains in one view
  • Spot top movers by value or percentage
  • Review allocation across holdings, sectors, and assets
  • Keep upcoming portfolio events close to the numbers
Navero mobile portfolio overview

Connections and imports

Portfolio in sync.

Connect supported brokers, import CSV files, or add manual entries so every account, exchange, and custom holding can live inside one portfolio tracker.

Interactive Brokers

Broker connections, CSV imports, and manual entries feed the same portfolio dataset.

Navero mobile market update

AI market intelligence

Daily market updates

Use AI-generated market updates to turn macro context, sector developments, and holding-specific news into a daily briefing you can scan without leaving your portfolio workspace.

  • AI-generated market summaries connected to your portfolio context
  • Macro, sector, and holding-specific developments organized into one readable update
  • Source-backed AI research snippets for faster daily scanning

Trade history

Every transaction in context

Keep trade history, transaction flow, cash movements, and realized results connected to the holdings and accounts they belong to.

  • Review buys, sells, deposits, and portfolio cash movements
  • Connect trades to realized performance and holding history
  • Keep imported and manually entered activity in one audit trail
Navero trades dashboard

Analysis powered by AI

Explain your performance

Use AI-assisted performance analysis to explain attribution, benchmark comparison, risk and return context, and the portfolio drivers behind your actual investment results.

  • Compare your portfolio with common market benchmarks
  • Break down performance by account, holding, sector, asset type, and currency
  • Use AI-assisted explanations to understand what drove returns and what changed
Navero performance attribution report in a laptop mockup

Dividends and income

Know what your portfolio pays you

Keep dividend income, received payouts, expected payments, and income contribution visible next to the rest of your portfolio performance.

  • Track dividend income across accounts and holdings
  • Review received payouts, expected income, and dividend history
  • Understand how income contributes to total portfolio return
Navero mobile dividend tracking

Start simple. Expand later.

Start manually, connect supported brokers, or combine both as your investment tracking needs grow.

Portfolio tracking FAQ

Questions before switching

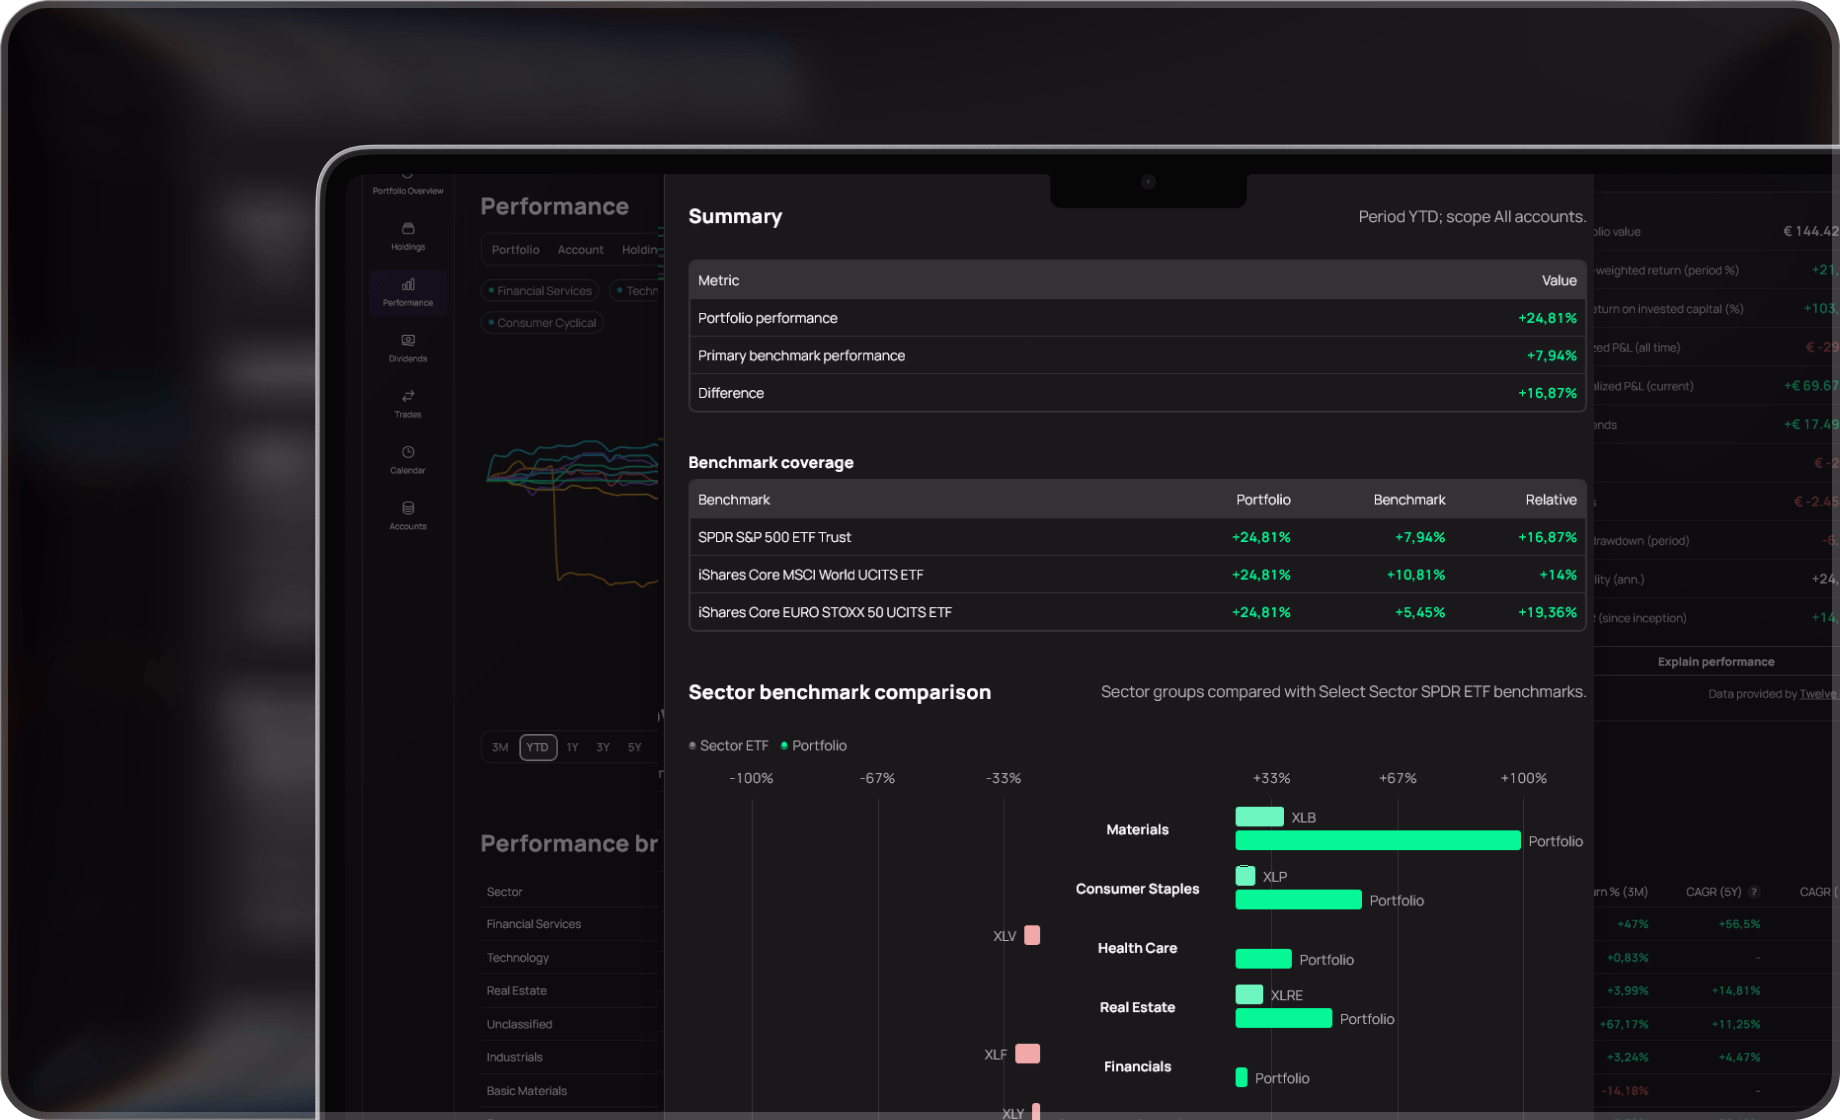
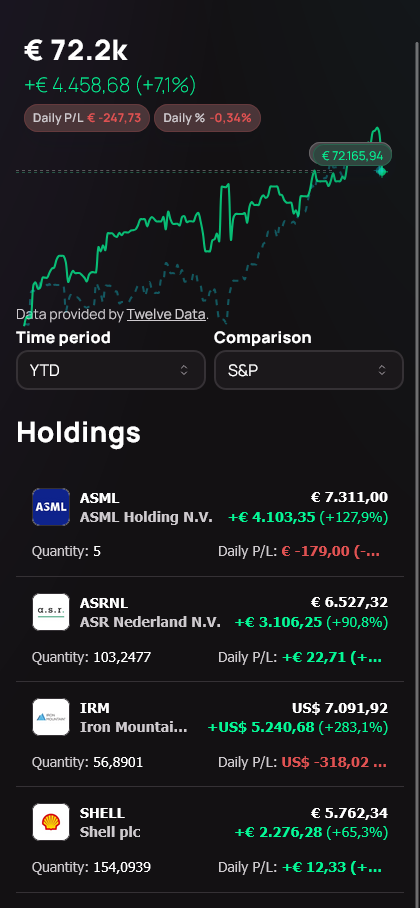
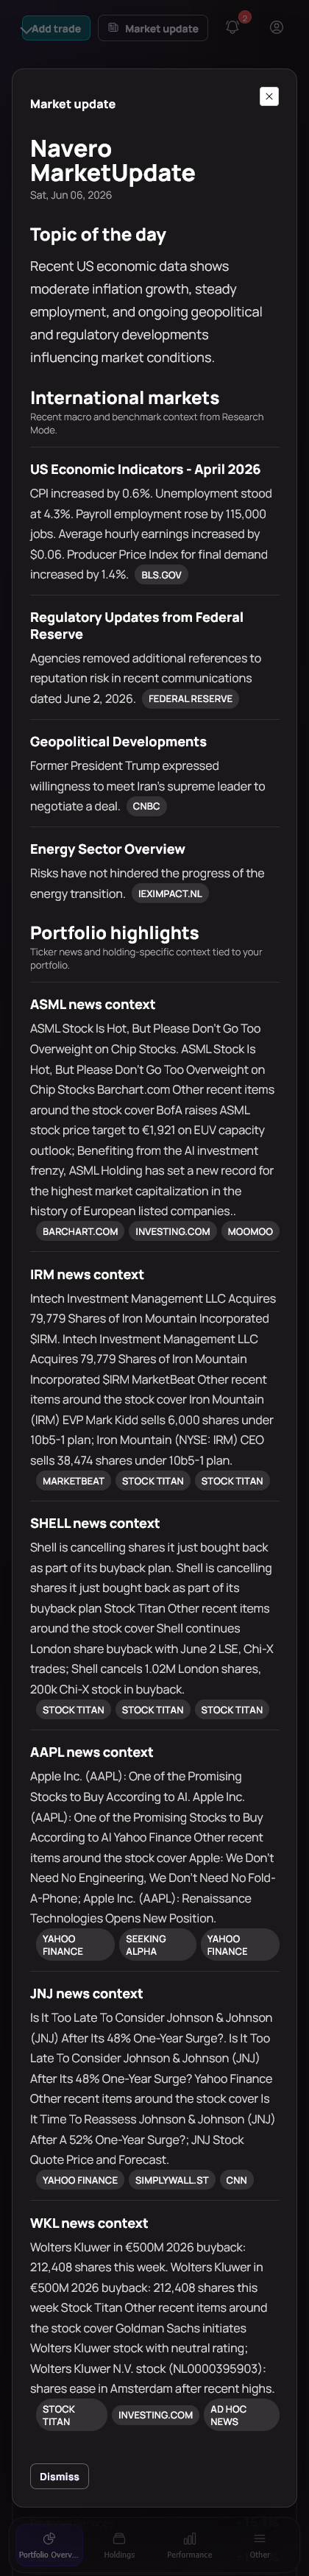
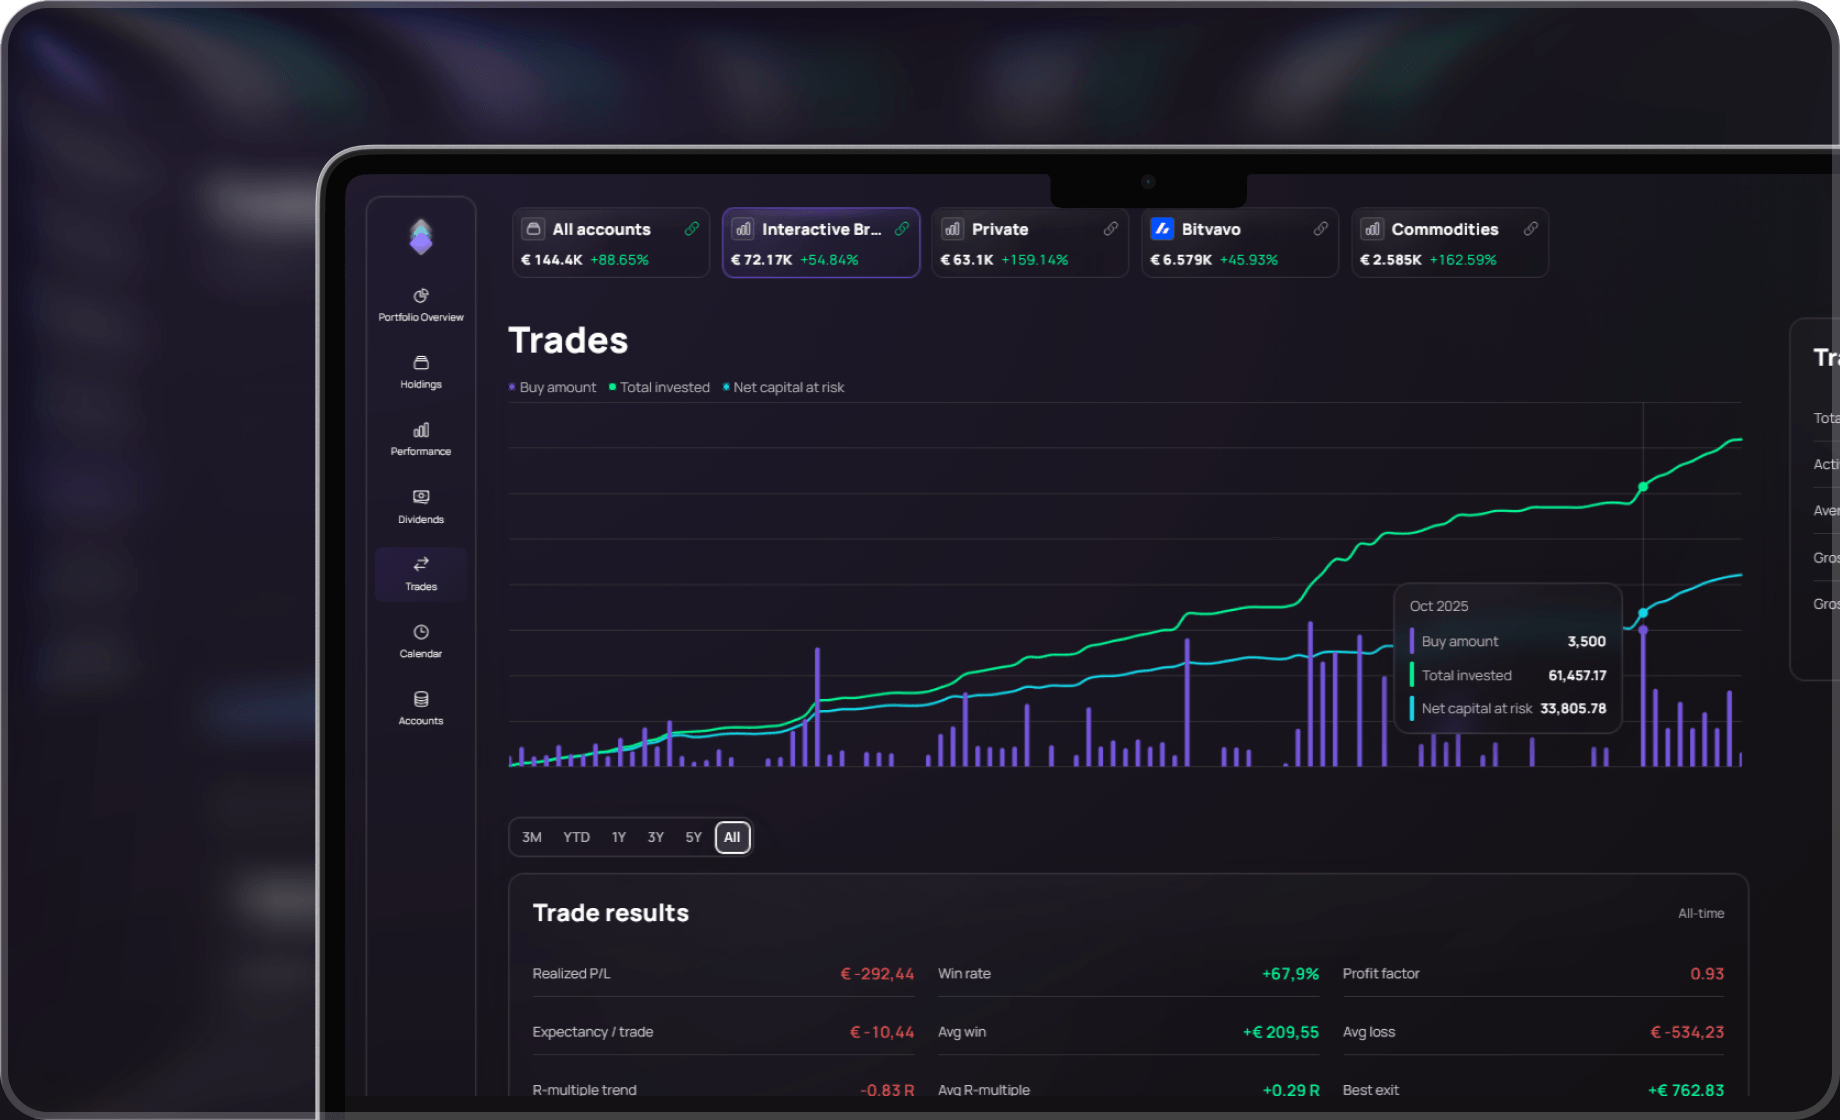
What problems does Navero solve for investors?

Navero brings portfolio value, holdings, trades, dividends, performance, broker connections, and market context into one investment dashboard so you do not have to reconcile multiple broker apps or spreadsheets.

How does Navero help explain portfolio performance?

Navero combines benchmark comparison, attribution views, realized and unrealized results, and AI-assisted performance reports to show what contributed to your returns over time.

Can I use Navero without a broker connection?

Yes. You can start manually, import CSV files, connect supported brokers where available, or combine these methods as your portfolio tracking setup grows.